
How To Install Elasticsearch, Logstash, and Kibana (Elastic Stack) on Ubuntu 22.04

· 20 min read
Thinh Nguyen
React Native Developer

How To Install Elasticsearch, Logstash, and Kibana (Elastic Stack) on Ubuntu 22.04

How To Install Elasticsearch, Logstash, and Kibana (Elastic Stack) on Ubuntu 22.04

Not using Ubuntu 22.04?Choose a different version or distribution.

Ubuntu 22.04

Introduction

The Elastic Stack — formerly known as the ELK Stack — is a collection of open-source software produced by Elastic which allows you to search, analyze, and visualize logs generated from any source in any format, a practice known as centralized logging. Centralized logging can be useful when attempting to identify problems with your servers or applications as it allows you to search through all of your logs in a single place. It’s also useful because it allows you to identify issues that span multiple servers by correlating their logs during a specific time frame.

The Elastic Stack has four main components:

  • Elasticsearch: a distributed RESTful search engine which stores all of the collected data.
  • Logstash: the data processing component of the Elastic Stack which sends incoming data to Elasticsearch.
  • Kibana: a web interface for searching and visualizing logs.
  • Beats: lightweight, single-purpose data shippers that can send data from hundreds or thousands of machines to either Logstash or Elasticsearch.

In this tutorial, you will install the Elastic Stack on an Ubuntu 22.04 server. You will learn how to install all of the components of the Elastic Stack — including Filebeat, a Beat used for forwarding and centralizing logs and files — and configure them to gather and visualize system logs. Additionally, because Kibana is normally only available on the localhost, we will use Nginx to proxy it so it will be accessible over a web browser. We will install all of these components on a single server, which we will refer to as our Elastic Stack server.

Note: When installing the Elastic Stack, you must use the same version across the entire stack. In this tutorial we will install the latest versions of the entire stack which are, at the time of this writing, Elasticsearch 7.7.1, Kibana 7.7.1, Logstash 7.7.1, and Filebeat 7.7.1.

Prerequisites

To complete this tutorial, you will need the following:

Additionally, because the Elastic Stack is used to access valuable information about your server that you would not want unauthorized users to access, it’s important that you keep your server secure by installing a TLS/SSL certificate. This is optional but strongly encouraged.

However, because you will ultimately make changes to your Nginx server block over the course of this guide, it would likely make more sense for you to complete the Let’s Encrypt on Ubuntu 22.04 guide at the end of this tutorial’s second step. With that in mind, if you plan to configure Let’s Encrypt on your server, you will need the following in place before doing so:

  • A fully qualified domain name (FQDN). This tutorial will use your_domain throughout. You can purchase a domain name on Namecheap, get one for free on Freenom, or use the domain registrar of your choice.
  • Both of the following DNS records set up for your server. You can follow this introduction to DigitalOcean DNS for details on how to add them.
    • An A record with your_domain pointing to your server’s public IP address.
    • An A record with www.your_domain pointing to your server’s public IP address.

Step 1 — Installing and Configuring Elasticsearch

The Elasticsearch components are not available in Ubuntu’s default package repositories. They can, however, be installed with APT after adding Elastic’s package source list.

All of the packages are signed with the Elasticsearch signing key in order to protect your system from package spoofing. Packages which have been authenticated using the key will be considered trusted by your package manager. In this step, you will import the Elasticsearch public GPG key and add the Elastic package source list in order to install Elasticsearch.

To begin, use cURL, the command line tool for transferring data with URLs, to import the Elasticsearch public GPG key into APT. Note that we are using the arguments -fsSL to silence all progress and possible errors (except for a server failure) and to allow cURL to make a request on a new location if redirected. Pipe the output of the curl command to the gpg --dearmor command, which converts the key into a format that apt can use to verify downloaded packages.

curl -fsSL https://artifacts.elastic.co/GPG-KEY-elasticsearch |sudo gpg --dearmor -o /usr/share/keyrings/elastic.gpg

Copy

Next, add the Elastic source list to the sources.list.d directory, where APT will search for new sources:

echo "deb [signed-by=/usr/share/keyrings/elastic.gpg] https://artifacts.elastic.co/packages/7.x/apt stable main" | sudo tee -a /etc/apt/sources.list.d/elastic-7.x.list

Copy

The [signed-by=/usr/share/keyrings/elastic.gpg] portion of the file instructs apt to use the key that you downloaded to verify repository and file information for Elasticsearch packages.

Next, update your package lists so APT will read the new Elastic source:

sudo apt update

Copy

Then install Elasticsearch with this command:

sudo apt install elasticsearch

Copy

Elasticsearch is now installed and ready to be configured. Use your preferred text editor to edit Elasticsearch’s main configuration file, elasticsearch.yml. Here, we’ll use nano:

sudo nano /etc/elasticsearch/elasticsearch.yml

Copy

Note: Elasticsearch’s configuration file is in YAML format, which means that we need to maintain the indentation format. Be sure that you do not add any extra spaces as you edit this file.

The elasticsearch.yml file provides configuration options for your cluster, node, paths, memory, network, discovery, and gateway. Most of these options are preconfigured in the file but you can change them according to your needs. For the purposes of our demonstration of a single-server configuration, we will only adjust the settings for the network host.

Elasticsearch listens for traffic from everywhere on port 9200. You will want to restrict outside access to your Elasticsearch instance to prevent outsiders from reading your data or shutting down your Elasticsearch cluster through its [REST API] (https://en.wikipedia.org/wiki/Representational_state_transfer). To restrict access and therefore increase security, find the line that specifies network.host, uncomment it, and replace its value with localhost like this:

/etc/elasticsearch/elasticsearch.yml

. . .
# ---------------------------------- Network -----------------------------------
#
# Set the bind address to a specific IP (IPv4 or IPv6):
#
network.host: localhost
. . .

We have specified localhost so that Elasticsearch listens on all interfaces and bound IPs. If you want it to listen only on a specific interface, you can specify its IP in place of localhost. Save and close elasticsearch.yml. If you’re using nano, you can do so by pressing CTRL+X, followed by Y and then ENTER .

These are the minimum settings you can start with in order to use Elasticsearch. Now you can start Elasticsearch for the first time.

Start the Elasticsearch service with systemctl. Give Elasticsearch a few moments to start up. Otherwise, you may get errors about not being able to connect.

sudo systemctl start elasticsearch

Copy

Next, run the following command to enable Elasticsearch to start up every time your server boots:

sudo systemctl enable elasticsearch

Copy

You can test whether your Elasticsearch service is running by sending an HTTP request:

curl -X GET "localhost:9200"

Copy

You will see a response showing some basic information about your local node, similar to this:

Output{
  "name" : "Elasticsearch",
  "cluster_name" : "elasticsearch",
  "cluster_uuid" : "n8Qu5CjWSmyIXBzRXK-j4A",
  "version" : {
    "number" : "7.17.2",
    "build_flavor" : "default",
    "build_type" : "deb",
    "build_hash" : "de7261de50d90919ae53b0eff9413fd7e5307301",
    "build_date" : "2022-03-28T15:12:21.446567561Z",
    "build_snapshot" : false,
    "lucene_version" : "8.11.1",
    "minimum_wire_compatibility_version" : "6.8.0",
    "minimum_index_compatibility_version" : "6.0.0-beta1"
  },
  "tagline" : "You Know, for Search"
}

Now that Elasticsearch is up and running, let’s install Kibana, the next component of the Elastic Stack.

Step 2 — Installing and Configuring the Kibana Dashboard

According to the official documentation, you should install Kibana only after installing Elasticsearch. Installing in this order ensures that the components each product depends on are correctly in place.

Because you’ve already added the Elastic package source in the previous step, you can just install the remaining components of the Elastic Stack using apt:

sudo apt install kibana

Copy

Then enable and start the Kibana service:

sudo systemctl enable kibana

Copy

sudo systemctl start kibana

Copy

Because Kibana is configured to only listen on localhost, we must set up a reverse proxy to allow external access to it. We will use Nginx for this purpose, which should already be installed on your server.

First, use the openssl command to create an administrative Kibana user which you’ll use to access the Kibana web interface. As an example we will name this account kibanaadmin, but to ensure greater security we recommend that you choose a non-standard name for your user that would be difficult to guess.

The following command will create the administrative Kibana user and password, and store them in the htpasswd.users file. You will configure Nginx to require this username and password and read this file momentarily:

echo "kibanaadmin:`openssl passwd -apr1`" | sudo tee -a /etc/nginx/htpasswd.users

Copy

Enter and confirm a password at the prompt. Remember or take note of this login, as you will need it to access the Kibana web interface.

Next, we will create an Nginx server block file. As an example, we will refer to this file as your_domain, although you may find it helpful to give yours a more descriptive name. For instance, if you have a FQDN and DNS records set up for this server, you could name this file after your FQDN.

Using nano or your preferred text editor, create the Nginx server block file:

sudo nano /etc/nginx/sites-available/your_domain

Copy

Add the following code block into the file, being sure to update your_domain to match your server’s FQDN or public IP address. This code configures Nginx to direct your server’s HTTP traffic to the Kibana application, which is listening on localhost:5601. Additionally, it configures Nginx to read the htpasswd.users file and require basic authentication.

Note that if you followed the prerequisite Nginx tutorial through to the end, you may have already created this file and populated it with some content. In that case, delete all the existing content in the file before adding the following:

/etc/nginx/sites-available/your_domain

server {
    listen 80;

    server_name your_domain;

    auth_basic "Restricted Access";
    auth_basic_user_file /etc/nginx/htpasswd.users;

    location / {
        proxy_pass http://localhost:5601;
        proxy_http_version 1.1;
        proxy_set_header Upgrade $http_upgrade;
        proxy_set_header Connection 'upgrade';
        proxy_set_header Host $host;
        proxy_cache_bypass $http_upgrade;
    }
}

Copy

When you’re finished, save and close the file.

Next, enable the new configuration by creating a symbolic link to the sites-enabled directory. If you already created a server block file with the same name in the Nginx prerequisite, you do not need to run this command:

sudo ln -s /etc/nginx/sites-available/your_domain /etc/nginx/sites-enabled/your_domain

Copy

Then check the configuration for syntax errors:

sudo nginx -t

Copy

If any errors are reported in your output, go back and double check that the content you placed in your configuration file was added correctly. Once you see syntax is ok in the output, go ahead and restart the Nginx service:

sudo systemctl reload nginx

Copy

If you followed the initial server setup guide, you should have a UFW firewall enabled. To allow connections to Nginx, we can adjust the rules by typing:

sudo ufw allow 'Nginx Full'

Copy

Note: If you followed the prerequisite Nginx tutorial, you may have created a UFW rule allowing the Nginx HTTP profile through the firewall. Because the Nginx Full profile allows both HTTP and HTTPS traffic through the firewall, you can safely delete the rule you created in the prerequisite tutorial. Do so with the following command:

sudo ufw delete allow 'Nginx HTTP'

Copy

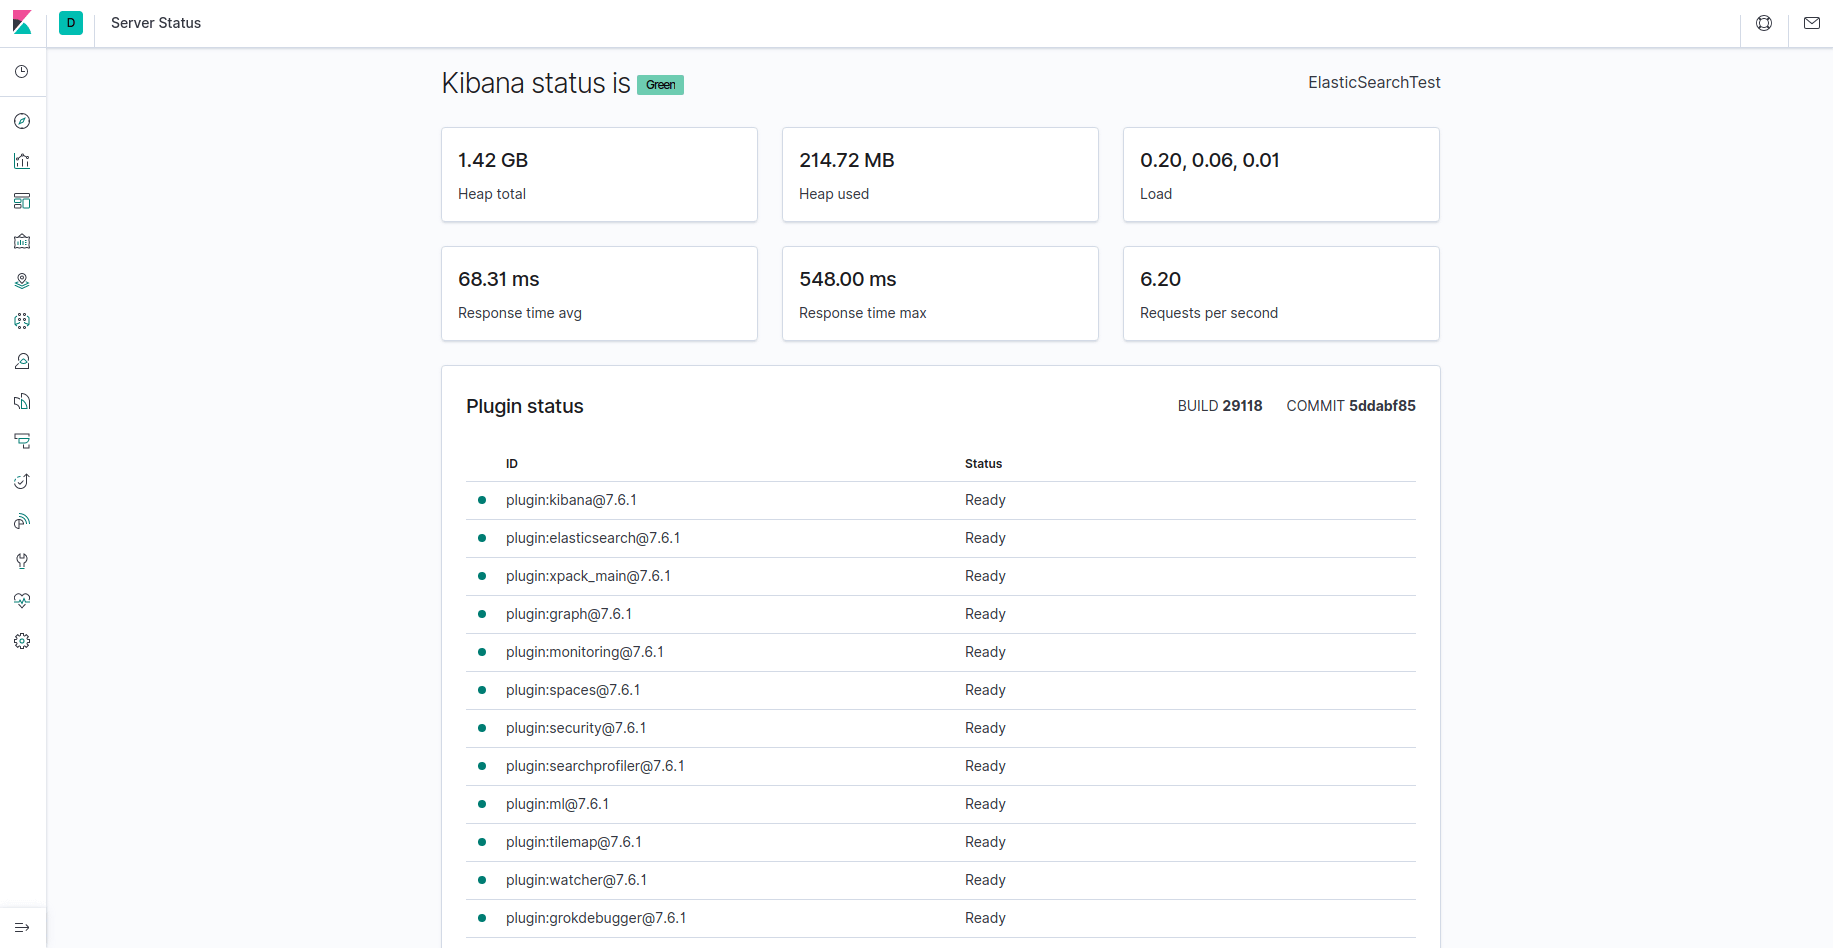
Kibana is now accessible via your FQDN or the public IP address of your Elastic Stack server. You can check the Kibana server’s status page by navigating to the following address and entering your login credentials when prompted:

http://your_domain/status

This status page displays information about the server’s resource usage and lists the installed plugins.

|Kibana status page

Note: As mentioned in the Prerequisites section, it is recommended that you enable SSL/TLS on your server. You can follow the Let’s Encrypt guide now to obtain a free TLS certificate for Nginx on Ubuntu 22.04. After obtaining your TLS certificates, you can come back and complete this tutorial.

Now that the Kibana dashboard is configured, let’s install the next component: Logstash.

Step 3 — Installing and Configuring Logstash

Although it’s possible for Beats to send data directly to the Elasticsearch database, it is common to use Logstash to process the data. This will allow you more flexibility to collect data from different sources, transform it into a common format, and export it to another database.

Install Logstash with this command:

sudo apt install logstash

Copy

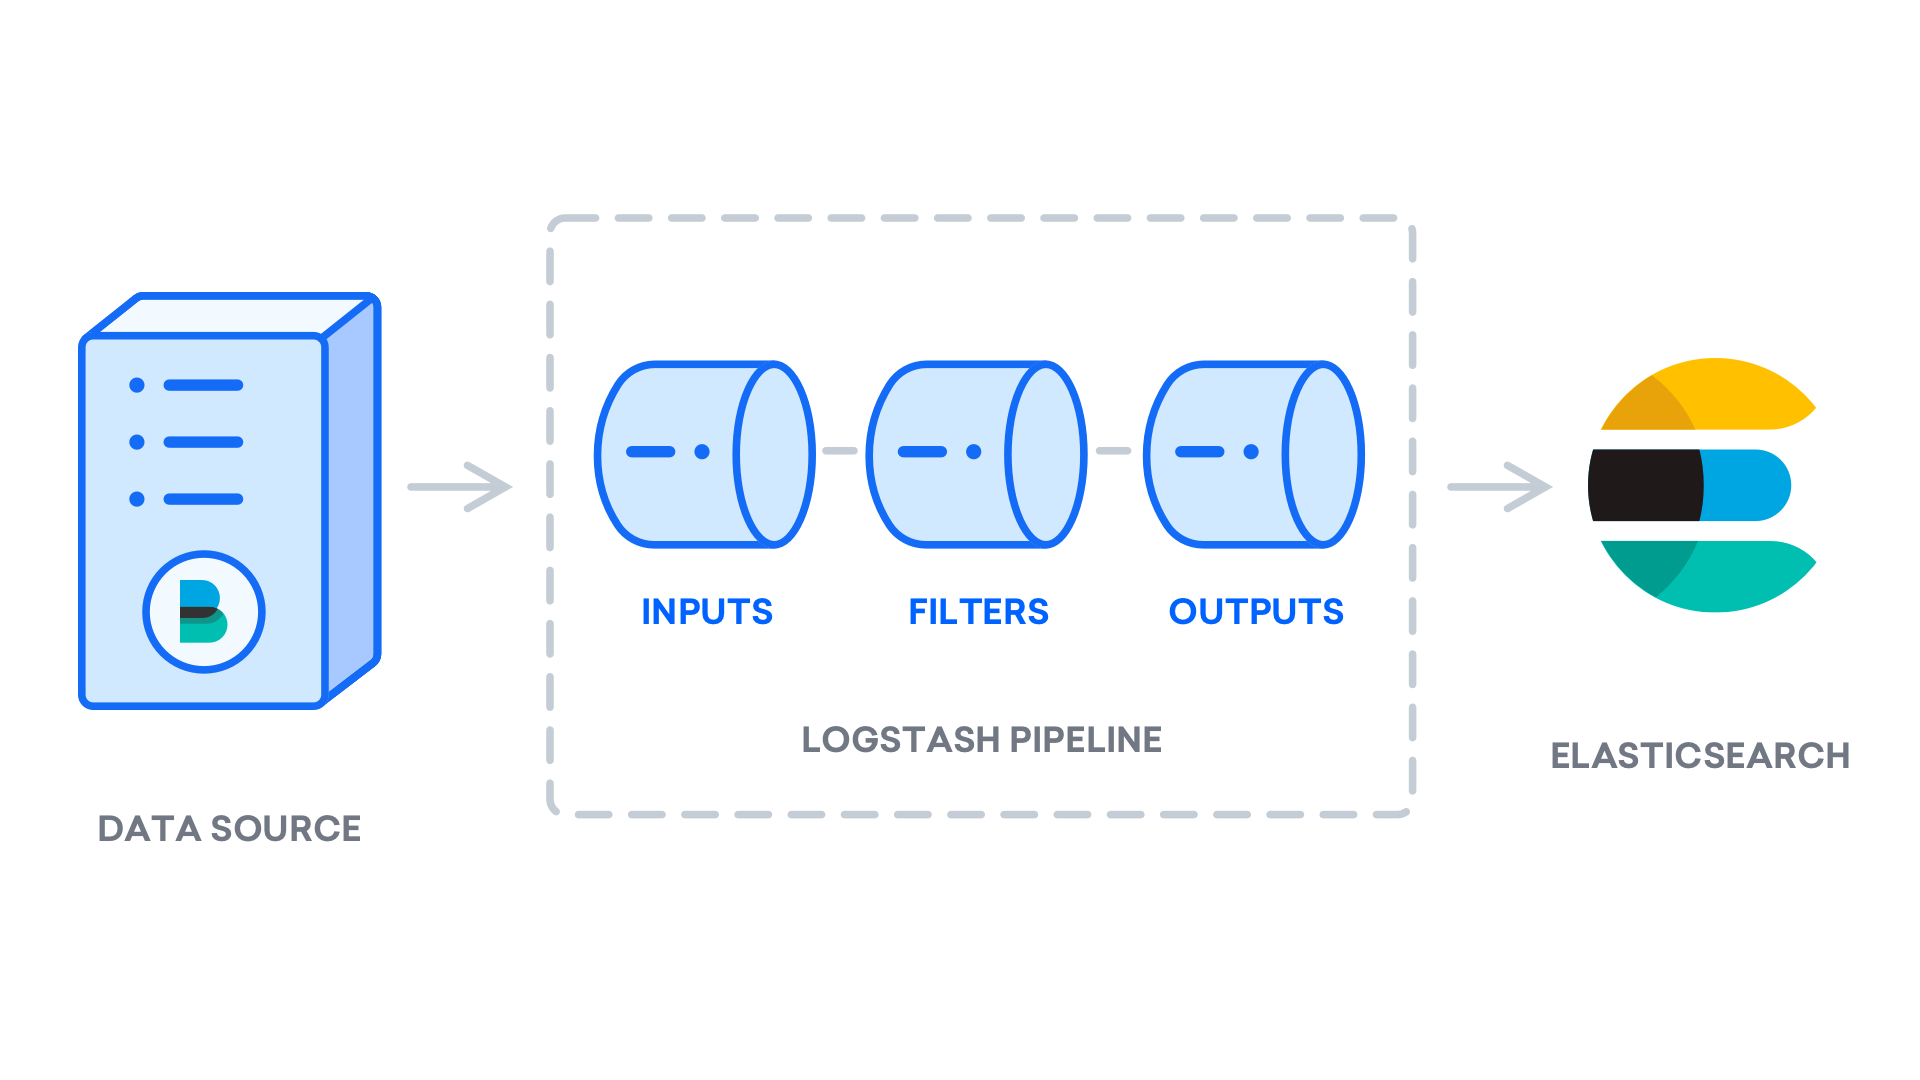
After installing Logstash, you can move on to configuring it. Logstash’s configuration files reside in the /etc/logstash/conf.d directory. For more information on the configuration syntax, you can check out the configuration reference that Elastic provides. As you configure the file, it’s helpful to think of Logstash as a pipeline which takes in data at one end, processes it in one way or another, and sends it out to its destination (in this case, the destination being Elasticsearch). A Logstash pipeline has two required elements, input and output, and one optional element, filter. The input plugins consume data from a source, the filter plugins process the data, and the output plugins write the data to a destination.

Logstash pipeline

Create a configuration file called 02-beats-input.conf where you will set up your Filebeat input:

sudo nano /etc/logstash/conf.d/02-beats-input.conf

Copy

Insert the following input configuration. This specifies a beats input that will listen on TCP port 5044.

/etc/logstash/conf.d/02-beats-input.conf

input {
  beats {
    port => 5044
  }
}

Copy

Save and close the file.

Next, create a configuration file called 30-elasticsearch-output.conf:

sudo nano /etc/logstash/conf.d/30-elasticsearch-output.conf

Copy

Insert the following output configuration. Essentially, this output configures Logstash to store the Beats data in Elasticsearch, which is running at localhost:9200, in an index named after the Beat used. The Beat used in this tutorial is Filebeat:

/etc/logstash/conf.d/30-elasticsearch-output.conf

output {
  if [@metadata][pipeline] {
	elasticsearch {
  	hosts => ["localhost:9200"]
  	manage_template => false
  	index => "%{[@metadata][beat]}-%{[@metadata][version]}-%{+YYYY.MM.dd}"
  	pipeline => "%{[@metadata][pipeline]}"
	}
  } else {
	elasticsearch {
  	hosts => ["localhost:9200"]
  	manage_template => false
  	index => "%{[@metadata][beat]}-%{[@metadata][version]}-%{+YYYY.MM.dd}"
	}
  }
}


Copy

Save and close the file.

Test your Logstash configuration with this command:

sudo -u logstash /usr/share/logstash/bin/logstash --path.settings /etc/logstash -t

Copy

If there are no syntax errors, your output will display Config Validation Result: OK. Exiting Logstash after a few seconds. If you don’t see this in your output, check for any errors noted in your output and update your configuration to correct them. Note that you will receive warnings from OpenJDK, but they should not cause any problems and can be ignored.

If your configuration test is successful, start and enable Logstash to put the configuration changes into effect:

sudo systemctl start logstash

Copy

sudo systemctl enable logstash

Copy

Now that Logstash is running correctly and is fully configured, let’s install Filebeat.

Step 4 — Installing and Configuring Filebeat

The Elastic Stack uses several lightweight data shippers called Beats to collect data from various sources and transport them to Logstash or Elasticsearch. Here are the Beats that are currently available from Elastic:

  • Filebeat: collects and ships log files.
  • Metricbeat: collects metrics from your systems and services.
  • Packetbeat: collects and analyzes network data.
  • Winlogbeat: collects Windows event logs.
  • Auditbeat: collects Linux audit framework data and monitors file integrity.
  • Heartbeat: monitors services for their availability with active probing.

In this tutorial we will use Filebeat to forward local logs to our Elastic Stack.

Install Filebeat using apt:

sudo apt install filebeat

Copy

Next, configure Filebeat to connect to Logstash. Here, we will modify the example configuration file that comes with Filebeat.

Open the Filebeat configuration file:

sudo nano /etc/filebeat/filebeat.yml

Copy

Note: As with Elasticsearch, Filebeat’s configuration file is in YAML format. This means that proper indentation is crucial, so be sure to use the same number of spaces that are indicated in these instructions.

Filebeat supports numerous outputs, but you’ll usually only send events directly to Elasticsearch or to Logstash for additional processing. In this tutorial, we’ll use Logstash to perform additional processing on the data collected by Filebeat. Filebeat will not need to send any data directly to Elasticsearch, so let’s disable that output. To do so, find the output.elasticsearch section and comment out the following lines by preceding them with a #:

/etc/filebeat/filebeat.yml

...
#output.elasticsearch:
  # Array of hosts to connect to.
  #hosts: ["localhost:9200"]
...

Then, configure the output.logstash section. Uncomment the lines output.logstash: and hosts: ["localhost:5044"] by removing the #. This will configure Filebeat to connect to Logstash on your Elastic Stack server at port 5044, the port for which we specified a Logstash input earlier:

/etc/filebeat/filebeat.yml

output.logstash:
  # The Logstash hosts
  hosts: ["localhost:5044"]

Save and close the file.

The functionality of Filebeat can be extended with Filebeat modules. In this tutorial we will use the system module, which collects and parses logs created by the system logging service of common Linux distributions.

Let’s enable it:

sudo filebeat modules enable system

Copy

You can see a list of enabled and disabled modules by running:

sudo filebeat modules list

Copy

You will see a list similar to the following:

OutputEnabled:
system

Disabled:
apache2
auditd
elasticsearch
icinga
iis
kafka
kibana
logstash
mongodb
mysql
nginx
osquery
postgresql
redis
traefik
...

By default, Filebeat is configured to use default paths for the syslog and authorization logs. In the case of this tutorial, you do not need to change anything in the configuration. You can see the parameters of the module in the /etc/filebeat/modules.d/system.yml configuration file.

Next, we need to set up the Filebeat ingest pipelines, which parse the log data before sending it through logstash to Elasticsearch. To load the ingest pipeline for the system module, enter the following command:

sudo filebeat setup --pipelines --modules system

Copy

Next, load the index template into Elasticsearch. An Elasticsearch index is a collection of documents that have similar characteristics. Indexes are identified with a name, which is used to refer to the index when performing various operations within it. The index template will be automatically applied when a new index is created.

To load the template, use the following command:

sudo filebeat setup --index-management -E output.logstash.enabled=false -E 'output.elasticsearch.hosts=["localhost:9200"]'

Copy

OutputIndex setup finished.

Filebeat comes packaged with sample Kibana dashboards that allow you to visualize Filebeat data in Kibana. Before you can use the dashboards, you need to create the index pattern and load the dashboards into Kibana.

As the dashboards load, Filebeat connects to Elasticsearch to check version information. To load dashboards when Logstash is enabled, you need to disable the Logstash output and enable Elasticsearch output:

sudo filebeat setup -E output.logstash.enabled=false -E output.elasticsearch.hosts=['localhost:9200'] -E setup.kibana.host=localhost:5601

Copy

After a few minutes, you should receive output similar to this:

OutputOverwriting ILM policy is disabled. Set `setup.ilm.overwrite:true` for enabling.

Index setup finished.
Loading dashboards (Kibana must be running and reachable)
Loaded dashboards
Setting up ML using setup --machine-learning is going to be removed in 8.0.0. Please use the ML app instead.
See more: https://www.elastic.co/guide/en/elastic-stack-overview/current/xpack-ml.html
Loaded machine learning job configurations
Loaded Ingest pipelines

Now you can start and enable Filebeat:

sudo systemctl start filebeat

Copy

sudo systemctl enable filebeat

Copy

If you’ve set up your Elastic Stack correctly, Filebeat will begin shipping your syslog and authorization logs to Logstash, which will then load that data into Elasticsearch.

To verify that Elasticsearch is indeed receiving this data, query the Filebeat index with this command:

curl -XGET 'http://localhost:9200/filebeat-*/_search?pretty'

Copy

You should receive output similar to this:

Output. . .
{
  "took" : 4,
  "timed_out" : false,
  "_shards" : {
    "total" : 2,
    "successful" : 2,
    "skipped" : 0,
    "failed" : 0
  },
  "hits" : {
    "total" : {
      "value" : 4040,
      "relation" : "eq"
    },
    "max_score" : 1.0,
    "hits" : [
      {
        "_index" : "filebeat-7.17.2-2022.04.18",
        "_type" : "_doc",
        "_id" : "YhwePoAB2RlwU5YB6yfP",
        "_score" : 1.0,
        "_source" : {
          "cloud" : {
            "instance" : {
              "id" : "294355569"
            },
            "provider" : "digitalocean",
            "service" : {
              "name" : "Droplets"
            },
            "region" : "tor1"
          },
          "@timestamp" : "2022-04-17T04:42:06.000Z",
          "agent" : {
            "hostname" : "elasticsearch",
            "name" : "elasticsearch",
            "id" : "b47ca399-e6ed-40fb-ae81-a2f2d36461e6",
            "ephemeral_id" : "af206986-f3e3-4b65-b058-7455434f0cac",
            "type" : "filebeat",
            "version" : "7.17.2"
          },
. . .

If your output shows 0 total hits, Elasticsearch is not loading any logs under the index you searched for, and you will need to review your setup for errors. If you received the expected output, continue to the next step, in which we will see how to navigate through some of Kibana’s dashboards.

Step 5 — Exploring Kibana Dashboards

Let’s return to the Kibana web interface that we installed earlier.

In a web browser, go to the FQDN or public IP address of your Elastic Stack server. If your session has been interrupted, you will need to re-enter entering the credentials you defined in Step 2. Once you have logged in, you should receive the Kibana homepage:

Kibana Homepage

Click the Discover link in the left-hand navigation bar (you may have to click the the Expand icon at the very bottom left to see the navigation menu items). On the Discover page, select the predefined filebeat-* index pattern to see Filebeat data. By default, this will show you all of the log data over the last 15 minutes. You will see a histogram with log events, and some log messages below:

Discover page

Here, you can search and browse through your logs and also customize your dashboard. At this point, though, there won’t be much in there because you are only gathering syslogs from your Elastic Stack server.

Use the left-hand panel to navigate to the Dashboard page and search for the Filebeat System dashboards. Once there, you can select the sample dashboards that come with Filebeat’s system module.

For example, you can view detailed stats based on your syslog messages:

Syslog Dashboard

You can also view which users have used the sudo command and when:

Sudo Dashboard

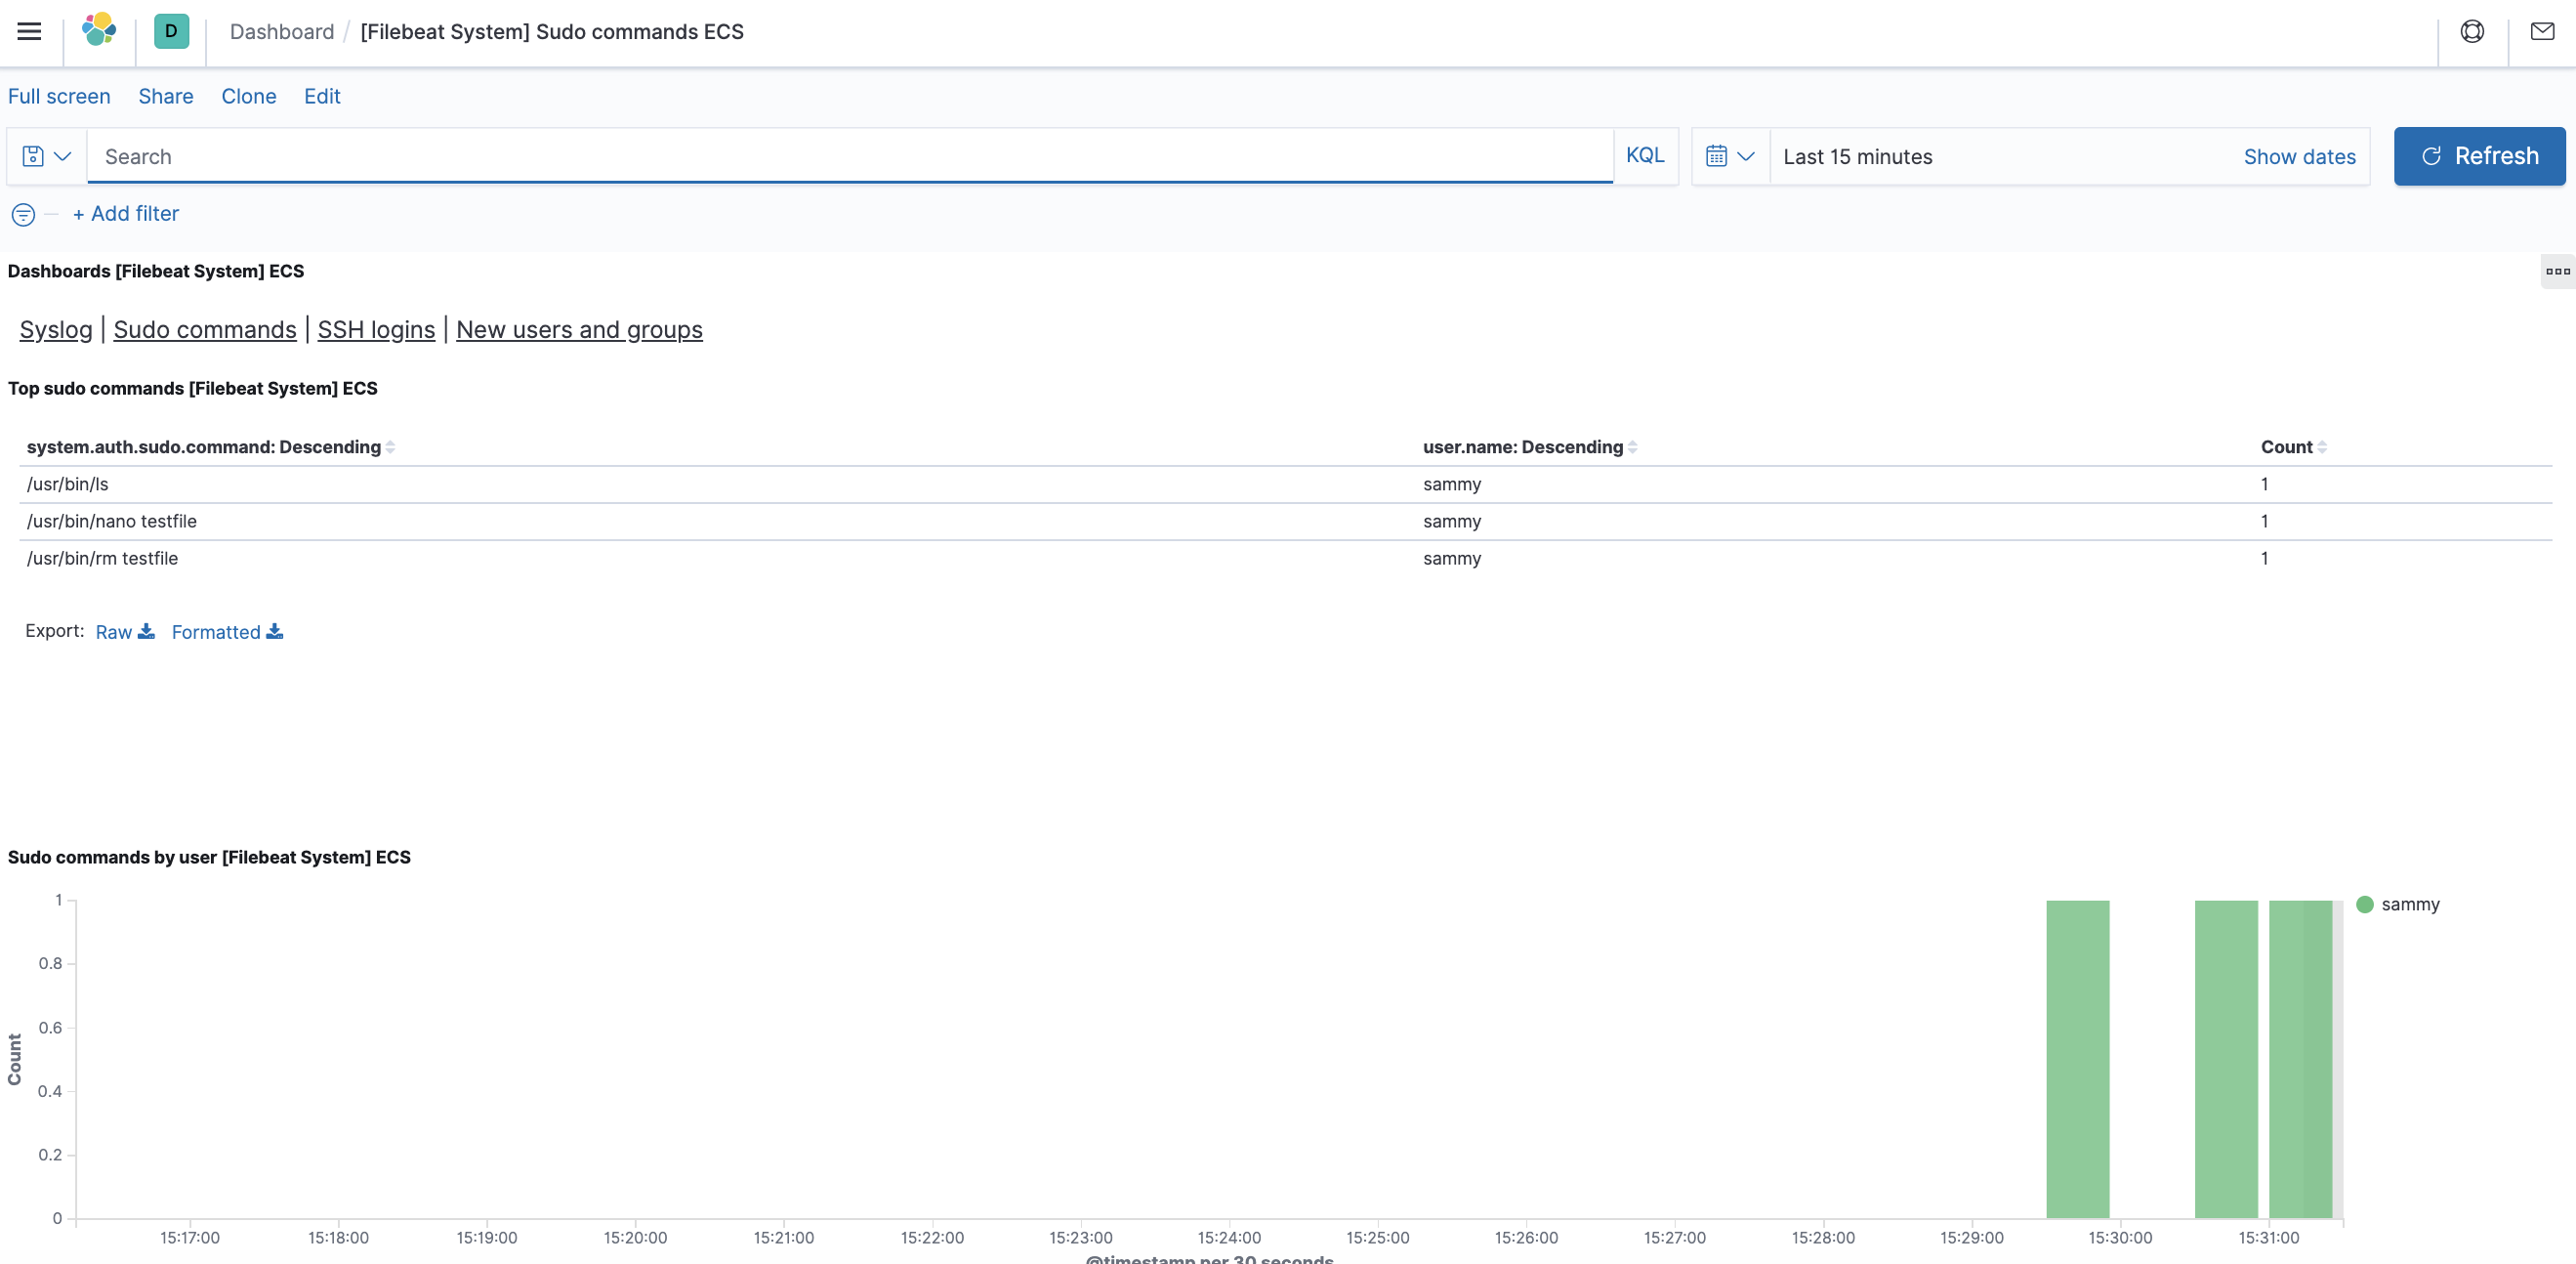
Kibana has many other features, such as graphing and filtering, so feel free to explore.

Conclusion

In this tutorial, you’ve learned how to install and configure the Elastic Stack to collect and analyze system logs. Remember that you can send just about any type of log or indexed data to Logstash using Beats, but the data becomes even more useful if it is parsed and structured with a Logstash filter, as this transforms the data into a consistent format that can be read easily by Elasticsearch.

How To Install Nginx on Ubuntu 20.04

· 11 min read
Thinh Nguyen
React Native Developer

How To Install Nginx on Ubuntu 20.04

Not using Ubuntu 20.04?Choose a different version or distribution.

Ubuntu 20.04

Introduction

Nginx is one of the most popular web servers in the world and is responsible for hosting some of the largest and highest-traffic sites on the internet. It is a lightweight choice that can be used as either a web server or reverse proxy.

In this guide, we’ll discuss how to install Nginx on your Ubuntu 20.04 server, adjust the firewall, manage the Nginx process, and set up server blocks for hosting more than one domain from a single server.

Simplify deploying applications with DigitalOcean App Platform. Deploy directly from GitHub in minutes.

Prerequisites

Before you begin this guide, you should have a regular, non-root user with sudo privileges configured on your server. You can learn how to configure a regular user account by following our Initial server setup guide for Ubuntu 20.04.

You will also optionally want to have registered a domain name before completing the last steps of this tutorial. To learn more about setting up a domain name with DigitalOcean, please refer to our Introduction to DigitalOcean DNS.

When you have an account available, log in as your non-root user to begin.

Step 1 – Installing Nginx

Because Nginx is available in Ubuntu’s default repositories, it is possible to install it from these repositories using the apt packaging system.

Since this is our first interaction with the apt packaging system in this session, we will update our local package index so that we have access to the most recent package listings. Afterwards, we can install nginx:

sudo apt update
sudo apt install nginx

Copy

After accepting the procedure, apt will install Nginx and any required dependencies to your server.

Step 2 – Adjusting the Firewall

Before testing Nginx, the firewall software needs to be adjusted to allow access to the service. Nginx registers itself as a service with ufw upon installation, making it straightforward to allow Nginx access.

List the application configurations that ufw knows how to work with by typing:

sudo ufw app list

Copy

You should get a listing of the application profiles:

OutputAvailable applications:
  Nginx Full
  Nginx HTTP
  Nginx HTTPS
  OpenSSH

As demonstrated by the output, there are three profiles available for Nginx:

  • Nginx Full: This profile opens both port 80 (normal, unencrypted web traffic) and port 443 (TLS/SSL encrypted traffic)
  • Nginx HTTP: This profile opens only port 80 (normal, unencrypted web traffic)
  • Nginx HTTPS: This profile opens only port 443 (TLS/SSL encrypted traffic)

It is recommended that you enable the most restrictive profile that will still allow the traffic you’ve configured. Right now, we will only need to allow traffic on port 80.

You can enable this by typing:

sudo ufw allow 'Nginx HTTP'

Copy

You can verify the change by typing:

sudo ufw status

Copy

The output will indicated which HTTP traffic is allowed:

OutputStatus: active

To                         Action      From
--                         ------      ----
OpenSSH                    ALLOW       Anywhere                  
Nginx HTTP                 ALLOW       Anywhere                  
OpenSSH (v6)               ALLOW       Anywhere (v6)             
Nginx HTTP (v6)            ALLOW       Anywhere (v6)

Step 3 – Checking your Web Server

At the end of the installation process, Ubuntu 20.04 starts Nginx. The web server should already be up and running.

We can check with the systemd init system to make sure the service is running by typing:

systemctl status nginx

Copy

Output● nginx.service - A high performance web server and a reverse proxy server
   Loaded: loaded (/lib/systemd/system/nginx.service; enabled; vendor preset: enabled)
   Active: active (running) since Fri 2020-04-20 16:08:19 UTC; 3 days ago
     Docs: man:nginx(8)
 Main PID: 2369 (nginx)
    Tasks: 2 (limit: 1153)
   Memory: 3.5M
   CGroup: /system.slice/nginx.service
           ├─2369 nginx: master process /usr/sbin/nginx -g daemon on; master_process on;
           └─2380 nginx: worker process

As confirmed by this out, the service has started successfully. However, the best way to test this is to actually request a page from Nginx.

You can access the default Nginx landing page to confirm that the software is running properly by navigating to your server’s IP address. If you do not know your server’s IP address, you can find it by using the icanhazip.com tool, which will give you your public IP address as received from another location on the internet:

curl -4 icanhazip.com

Copy

When you have your server’s IP address, enter it into your browser’s address bar:

http://your_server_ip

You should receive the default Nginx landing page:

Nginx default page

If you are on this page, your server is running correctly and is ready to be managed.

Step 4 – Managing the Nginx Process

Now that you have your web server up and running, let’s review some basic management commands.

To stop your web server, type:

sudo systemctl stop nginx

Copy

To start the web server when it is stopped, type:

sudo systemctl start nginx

Copy

To stop and then start the service again, type:

sudo systemctl restart nginx

Copy

If you are only making configuration changes, Nginx can often reload without dropping connections. To do this, type:

sudo systemctl reload nginx

Copy

By default, Nginx is configured to start automatically when the server boots. If this is not what you want, you can disable this behavior by typing:

sudo systemctl disable nginx

Copy

To re-enable the service to start up at boot, you can type:

sudo systemctl enable nginx

Copy

You have now learned basic management commands and should be ready to configure the site to host more than one domain.

When using the Nginx web server, server blocks (similar to virtual hosts in Apache) can be used to encapsulate configuration details and host more than one domain from a single server. We will set up a domain called your_domain, but you should replace this with your own domain name.

Nginx on Ubuntu 20.04 has one server block enabled by default that is configured to serve documents out of a directory at /var/www/html. While this works well for a single site, it can become unwieldy if you are hosting multiple sites. Instead of modifying /var/www/html, let’s create a directory structure within /var/www for our your_domain site, leaving /var/www/html in place as the default directory to be served if a client request doesn’t match any other sites.

Create the directory for your_domain as follows, using the -p flag to create any necessary parent directories:

sudo mkdir -p /var/www/your_domain/html

Copy

Next, assign ownership of the directory with the $USER environment variable:

sudo chown -R $USER:$USER /var/www/your_domain/html

Copy

The permissions of your web roots should be correct if you haven’t modified your umask value, which sets default file permissions. To ensure that your permissions are correct and allow the owner to read, write, and execute the files while granting only read and execute permissions to groups and others, you can input the following command:

sudo chmod -R 755 /var/www/your_domain

Copy

Next, create a sample index.html page using nano or your favorite editor:

sudo nano /var/www/your_domain/html/index.html

Copy

Inside, add the following sample HTML:

/var/www/your_domain/html/index.html

<html>
    <head>
        <title>Welcome to your_domain!</title>
    </head>
    <body>
        <h1>Success!  The your_domain server block is working!</h1>
    </body>
</html>

Copy

Save and close the file by pressing Ctrl+X to exit, then when prompted to save, Y and then Enter.

In order for Nginx to serve this content, it’s necessary to create a server block with the correct directives. Instead of modifying the default configuration file directly, let’s make a new one at /etc/nginx/sites-available/your_domain:

sudo nano /etc/nginx/sites-available/your_domain

Copy

Paste in the following configuration block, which is similar to the default, but updated for our new directory and domain name:

/etc/nginx/sites-available/your_domain

server {
        listen 80;
        listen [::]:80;

        root /var/www/your_domain/html;
        index index.html index.htm index.nginx-debian.html;

        server_name your_domain www.your_domain;

        location / {
                try_files $uri $uri/ =404;
        }
}

Copy

Notice that we’ve updated the root configuration to our new directory, and the server_name to our domain name.

Next, let’s enable the file by creating a link from it to the sites-enabled directory, which Nginx reads from during startup:

sudo ln -s /etc/nginx/sites-available/your_domain /etc/nginx/sites-enabled/

Copy

Note: Nginx uses a common practice called symbolic links, or symlinks, to track which of your server blocks are enabled. Creating a symlink is like creating a shortcut on disk, so that you could later delete the shortcut from the sites-enabled directory while keeping the server block in sites-available if you wanted to enable it.

Two server blocks are now enabled and configured to respond to requests based on their listen and server_name directives (you can read more about how Nginx processes these directives here):

  • your_domain: Will respond to requests for your_domain and www.your_domain.
  • default: Will respond to any requests on port 80 that do not match the other two blocks.

To avoid a possible hash bucket memory problem that can arise from adding additional server names, it is necessary to adjust a single value in the /etc/nginx/nginx.conf file. Open the file:

sudo nano /etc/nginx/nginx.conf

Copy

Find the server_names_hash_bucket_size directive and remove the # symbol to uncomment the line. If you are using nano, you can quickly search for words in the file by pressing CTRL and w.

Note: Commenting out lines of code – usually by putting # at the start of a line – is another way of disabling them without needing to actually delete them. Many configuration files ship with multiple options commented out so that they can be enabled or disabled, by toggling them between active code and documentation.

/etc/nginx/nginx.conf

...
http {
    ...
    server_names_hash_bucket_size 64;
    ...
}
...

Save and close the file when you are finished.

Next, test to make sure that there are no syntax errors in any of your Nginx files:

sudo nginx -t

Copy

If there aren’t any problems, restart Nginx to enable your changes:

sudo systemctl restart nginx

Copy

Nginx should now be serving your domain name. You can test this by navigating to http://your_domain, where you should see something like this:

Nginx first server block

Step 6 – Getting Familiar with Important Nginx Files and Directories

Now that you know how to manage the Nginx service itself, you should take a few minutes to familiarize yourself with a few important directories and files.

Content

  • /var/www/html: The actual web content, which by default only consists of the default Nginx page you saw earlier, is served out of the /var/www/html directory. This can be changed by altering Nginx configuration files.

Server Configuration

  • /etc/nginx: The Nginx configuration directory. All of the Nginx configuration files reside here.
  • /etc/nginx/nginx.conf: The main Nginx configuration file. This can be modified to make changes to the Nginx global configuration.
  • /etc/nginx/sites-available/: The directory where per-site server blocks can be stored. Nginx will not use the configuration files found in this directory unless they are linked to the sites-enabled directory. Typically, all server block configuration is done in this directory, and then enabled by linking to the other directory.
  • /etc/nginx/sites-enabled/: The directory where enabled per-site server blocks are stored. Typically, these are created by linking to configuration files found in the sites-available directory.
  • /etc/nginx/snippets: This directory contains configuration fragments that can be included elsewhere in the Nginx configuration. Potentially repeatable configuration segments are good candidates for refactoring into snippets.

Server Logs

  • /var/log/nginx/access.log: Every request to your web server is recorded in this log file unless Nginx is configured to do otherwise.
  • /var/log/nginx/error.log: Any Nginx errors will be recorded in this log.

Conclusion

Now that you have your web server installed, you have many options for the type of content to serve and the technologies you want to use to create a richer experience.

If you’d like to build out a more complete application stack, check out the article How To Install Linux, Nginx, MySQL, PHP (LEMP stack) on Ubuntu 20.04.

In order to set up HTTPS for your domain name with a free SSL certificate using Let’s Encrypt, you should move on to How To Secure Nginx with Let’s Encrypt on Ubuntu 20.04.

Interview React Leader

· 15 min read
Thinh Nguyen
React Native Developer

Summary

A front-end developer with over 10 years of experience reflects on a job interview that extensively covered foundational JavaScript concepts, ReactJS, and the evolution of asynchronous programming in JavaScript.

Abstract

The web content describes a conversation between two front-end developers, where "A," the interviewee, recounts his experience being asked about basic JavaScript language and ReactJS framework questions during a job interview for a lead front-end role. Despite his extensive experience, "A" was caught off guard by the depth of the foundational questions. The interview also delved into the history of JavaScript frameworks, object-oriented programming in JavaScript, the importance of the virtual DOM in ReactJS, and the evolution of asynchronous programming patterns from callbacks to promises and then to async-await. "A" and his friend discuss the reasons behind such questioning, suggesting that interviewers may test a candidate's depth of knowledge and understanding of core concepts, especially when the CV does not provide enough discussion points. The conversation includes detailed explanations of JavaScript's prototype system, the differences between Redux and MVC design patterns, and the benefits of ReactJS's component-based architecture. The friend offers encouragement and insight, emphasizing the importance of being able to discuss the "histories" of technology and the need for a solid foundation in the basics, even with extensive experience.

Opinions

  • The interviewer's focus on foundational JavaScript and ReactJS concepts indicates a desire to assess "A's" depth of understanding, which is crucial for a lead role.
  • The interviewer may have found "A's" CV lacking in specific details, prompting a shift to more general technical discussions.
  • "A" acknowledges that while he did not prepare for such basic questions, the interview provided an opportunity to demonstrate his comprehensive knowledge.
  • The friend suggests that the interviewer might have been unfamiliar with "A's" CV or wanted to extend the interview by discussing general topics.
  • The discussion highlights the importance of a strong command of foundational technologies, even for experienced developers, to succeed in interviews.
  • The evolution of JavaScript from callbacks to promises and async-await reflects the language's maturation and the industry's shift towards more readable and maintainable asynchronous code.
  • The friend's perspective implies that understanding the historical context of JavaScript frameworks and patterns is valuable for senior developers.

And They Asked Me a Couple of Tough Questions

Last week

My friend is a front-end lead who has 10yrs+ exp and wants to change jobs, recently he interviewed with a few companies.

“Today, my interviewer dived deep into some basic questions about the JavaScript language and the ReactJS framework itself. It was the first time someone asked me these kinds of questions,” my friend, whom I’ll call “A,” said.

“Perhaps they see that you’re pursuing a lead role and want to test your understanding of foundational concepts. Did you manage to answer all the questions?” I asked.

“Only some of them. I never prepared that much,” he replied.

“It’s not necessarily about your interview preparation. It could be that the interviewer wanted to ensure you both had a common understanding of the basics. Sometimes they still have time and find nothing specific from your CV to discuss, so they test your depth of knowledge on general topics, especially if they are well-versed in them,” I suggested.

“Why did he find nothing from my CV to discuss, there is a bunch of experience!” He asked.

“Well, maybe he doesn’t know them well, haha,” I said.

“I see, or maybe they are not interested in my recent projects haha,” A said.

“I’m not sure, or maybe you answered all their questions too fast but there was still time. They wanted to get you, so they wanted to talk with you more. It depends. What did they ask you?” I asked.

“They asked how I know about ReactJS, given my 10+ years of experience. They wanted to know all the JavaScript frameworks I’ve been through on my road and how I think ReactJS differs from others. They talked about the pros and cons. They also asked about object-oriented programming in the JavaScript language itself, from the old-school days until now, and also about async-await and more. You know, all these are basic but if we want to talk about this histories for each could be tough to answer,” A recounted.

“Wow, sounds tough. Maybe we can discuss the details one by one, and I can share them with other front-end developers who are preparing for interviews like you,” I offered.

“Sure,” he agreed.

JavaScript Frameworks You’ve Used

My friend started in 2008 with old-school libraries like jQuery and ExtJS, then moved on to HandlebarsJS, EmberJS, KnockoutJS, AngularJS, and now ReactJS (he also tried VueJS a few years back). Based on design thinking, we can categorize them into three groups:

Binding-Based

  • KnockoutJS: It uses two-way data binding to connect the UI to the underlying data model. Changes in the model automatically update the UI and vice versa.
  • AngularJS: This framework also utilizes two-way data binding, making it easy to keep the model and view in sync. It allows automatic synchronization of data between the model (business logic) and view (UI).
  • Pros: These frameworks reduce the boilerplate code needed for DOM manipulation, making it easier to create dynamic applications.
  • Cons: Mixing the JS logic in HTML goes against the principle of Separation of Concerns, which may also introduce complexity and performance issues in large-scale applications due to excessive DOM updates.

Template-Based

  • HandlebarsJS: This is a way to build dynamic HTML pages by embedding expressions in HTML. It allows developers to create reusable templates for rendering content.
  • EmberJS: Uses a templating engine similar to HandlebarsJS to render dynamic content. Ember’s template system automatically updates the DOM when the underlying data changes.
  • Pros: Simple. These frameworks focus on separating the presentation layer from logic, promoting a clear separation of concerns. They simplify rendering by using templates to bind data to the UI efficiently.
  • Cons: When projects get bigger, you still need to write a lot of code, and much of the logic is duplicated. There are no reusable components, which can lead to code bloat and difficulty in maintaining a consistent structure across large applications.

Component-Based

  • ReactJS: Focuses on building reusable UI components. It uses a virtual DOM to optimize rendering performance.
  • VueJS: Combines the best of Angular and React with a component-based architecture that is flexible and easy to integrate.
  • Pros: These frameworks promote reusability and maintainability by encapsulating functionality within self-contained components. This modular approach simplifies the development of complex applications.
  • Cons: There is a learning curve, especially when integrating advanced features like state management and routing. Additionally, because React and Vue are libraries rather than full frameworks, developers must make more decisions about which additional tools and libraries to use, like redux.

Why Did You Choose ReactJS for Your Team?

  1. Strong Community Support/Flexible Ecosystem: React has a large and active community that contributes to its ecosystem, making it easier to find solutions, libraries, and best practices; allows developers to choose their own tools and libraries, making it adaptable to various project requirements.
  2. Virtual DOM Design: React’s virtual DOM improves performance by batching updates and reducing the number of direct manipulations to the actual DOM.
  3. Integration with Redux: React can be seamlessly integrated with Redux, which follows an event-driven and immutable design pattern.

You Mentioned Redux Design, How Do You Think It Differs from Others, Like the common MVC pattern?

MVC

  • Model-View-Controller (MVC): This is a common structure that has been used for many years. The idea is simple: the model holds the state, the controller handles business logic, and the view is responsible for presentation.
  • Model: Manages data and business rules.
  • View: Displays data and sends user inputs to the controller.
  • Controller: Processes inputs, calls the model, and updates the view.

Redux

A completely different flow.

  • Action: An action is dispatched, representing a change or event in the application.
  • Reducer: The reducer function takes the current state and the action, processes the update, and returns a new state. The state is immutable, so a new state object is created rather than modifying the existing state.
  • Store: The store holds the entire state tree of the application. When an action is dispatched and processed by the reducers, the store updates and notifies all components subscribed to it.
  • Component: Components subscribe to the store and react to state changes by re-rendering, ensuring the UI reflects the current state.

Key Differences

State Management

  • Redux: Centralizes state management using an event store, allowing easy tracking of all state changes, every change is immutable which serves as a single source of truth. This centralized state management approach is missing in traditional MVC patterns.
  • MVC: The State is often managed within individual models, leading to scattered state management in large applications.

Data Flow

  • Redux: Enforces One-way data flow. The flow starts from an action, dispatches changes to the store, and updates subscribed components.
  • MVC: Often involves bidirectional data flow. Changes can propagate from the view to the controller, updating the model and vice versa. This can lead to complex, intertwined dependencies.

Complexity and Reusability

  • Redux: Encourages reusable components and logic due to its centralized, generalized approach to state management and one-way data flow simplicity.
  • MVC: As applications grow, it can become difficult to maintain clear data flow and state management across multiple views and models, leading to potential duplication of logic and less reusable components.

And Why is the Virtual DOM Important?

Reflow and Repaint are both heavy.

The Virtual DOM boosts performance by minimizing browser reflows and repaints. Reflows are particularly expensive because they involve recalculating the layout of the page. Without the Virtual DOM, each of the X DOM operations would trigger a reflow and repaint. However, with the Virtual DOM, holding a “diff-tree” for the dom-difference, these operations are processed in batches, resulting in only one reflow and repaint.

An Example.

Let’s say we have some JS code directly manipulating the DOM 100 times; the difference is significant (1 reflow vs. 100 reflows):

https://readmedium.com/today-i-interviewed-for-a-lead-front-end-role-d4845e5ddd2e

Cấu trúc dữ liệu trong javascript

· 4 min read
Thinh Nguyen
React Native Developer

Chào tất cả các bạn! Trong bài viết này chúng ta sẽ tìm hiểu về một chủ đề quan trọng khi nó liên quan đến khoa học máy tính và software development: đó là data structures

Nó chắc chắn là một chủ đề mà bất cứ ai trên thế khới cũng phải biết làm việc trong lập trình, nhưng nó không khó để hiểu và không đáng sợ khi bạn bắt đầu làm quen với nó :))

Let's go !

Nội dung chính

  • Cấu trúc dữ liệu là gì
  • Mãng (Arrays)
  • Object (hash tables)
  • Stack (Ngăn xếp)
  • Queues
  • Linked lists
    • Single linked lists
    • Double linked list
  • Trees (Cây)
    • Binary trees
    • Heaps
  • Graphs
    • Cây đồ thị vô hướng và có hướng
    • Cây đồ thị có trọng số và không có trọng số

2022 sẽ là năm của kiến trúc mới trong mã nguồn mở

Vì bản phát hành gần đây, đây là khoảng thời gian tốt để tìm hiểu những thay đổi đang diễn ra và chúng có thể ảnh hưởng như thế nào để ứng dụng React Native của bạn

Trong bài viết này bao gồm hầu hết các thay đổi quan trọng bởi công nghệ mới

  • JavaScrip Interface(JSI)

  • Fabric

  • Turbo Modules

  • CodeGen

    Đầu tiên chúng ta sẽ đi tìm hiểu

Công nghệ hiện tại

Trước khi đến với công nghệ mới chúng ta sẽ tóm tắt công nghệ hiện tại làm việc như thế nào

Vui lòng lưu ý, Tôi chỉ bao gồm những điểm liên quan để hiểu blog này, nếu bạn muốn tìm hiểu nhiều hơn về công nghệ hiện tại vui lòng đọc tài liệu của react native

  • In a nutshell

Khi bạn chạy một ứng dụng RN, tất cả code Javascript của bạn sẽ được đóng gói lại với nhau thành một gói có tên là JS Bundle, Mã Native code được giữ nguyên

Việc thực thi của ứng dụng React Native sảy ra trong 3 luồng

  1. Javascript Thread: sử dụng JS Engine, để chạy JS Bundle
  2. Native/UI Thread: nó sử dụng để Native Modules và xử lý hoạt động giống UI Rendering, sủ dụng gesture events
  3. Ngoài ra Thread thứ 3 gọi là shadow thread, Được sử dụng để tính toán bố cục của các phần tử trước khi hiển thị chúng trên màn hình

Giao tiếp giữa JS và Native Threads được giao tiếp thông qua một cây cầu, Khi gửi dữ liệu đi qua cây cầu nó sẽ được chia thành từng phần(tối ưu hóa) và được phân ra dưới dạng JSON, Cây cầu này có thể chỉ xử lý các giao tiếp bất đồng bộ

Docusaurus Plushie

Một số điều kiện quan trọng:

JavascriptCore: nó là tên của Javascript Engine, cái mà React Native sử dụng để thực thi JS Code

Yoga: Là tên của Layout Engine, cái mà sử dụng để tính toán vị trí của phần tử UI của người dùng trên màn hình

1. Javascript Interface (JSI)

Trong công nghệ hiện tại, React native sử dụng Bridge Module để tạo các giao tiếp giữa JS code và Native threads, Mỗi khi data được gửi đến cây cầu, nó phải được đăng ký dưới dàng JSON, Khi dữ liệu được nhận ở phía bên kia nó cũng được giải mã

Nó có nghĩa là Javascript và Native hoạt động không biết về nhau (ie. JS Thread không thể gọi trực tiếp một phương thức trên luồng Native)

Một điều quan trọng khác, Các thông báo gửi qua cầu về bản chất là không đồng bộ, đây là một điều tốt cho hầu hết các trường hợp sử dụng, nhưng có một số trường hợp khi mã JS và mã gốc cần được đồng bộ hóa

Javascript Question

· 4 min read
Thinh Nguyen
React Native Developer

Chào tất cả các bạn! Trong bài viết này chúng ta sẽ tìm hiểu về một chủ đề quan trọng khi nó liên quan đến khoa học máy tính và software development: đó là data structures

Nó chắc chắn là một chủ đề mà bất cứ ai trên thế khới cũng phải biết làm việc trong lập trình, nhưng nó không khó để hiểu và không đáng sợ khi bạn bắt đầu làm quen với nó :))

Let's go !

Nội dung chính

  • Cấu trúc dữ liệu là gì
  • Mãng (Arrays)
  • Object (hash tables)
  • Stack (Ngăn xếp)
  • Queues
  • Linked lists
    • Single linked lists
    • Double linked list
  • Trees (Cây)
    • Binary trees
    • Heaps
  • Graphs
    • Cây đồ thị vô hướng và có hướng
    • Cây đồ thị có trọng số và không có trọng số

2022 sẽ là năm của kiến trúc mới trong mã nguồn mở

Vì bản phát hành gần đây, đây là khoảng thời gian tốt để tìm hiểu những thay đổi đang diễn ra và chúng có thể ảnh hưởng như thế nào để ứng dụng React Native của bạn

Trong bài viết này bao gồm hầu hết các thay đổi quan trọng bởi công nghệ mới

  • JavaScrip Interface(JSI)

  • Fabric

  • Turbo Modules

  • CodeGen

    Đầu tiên chúng ta sẽ đi tìm hiểu

Công nghệ hiện tại

Trước khi đến với công nghệ mới chúng ta sẽ tóm tắt công nghệ hiện tại làm việc như thế nào

Vui lòng lưu ý, Tôi chỉ bao gồm những điểm liên quan để hiểu blog này, nếu bạn muốn tìm hiểu nhiều hơn về công nghệ hiện tại vui lòng đọc tài liệu của react native

  • In a nutshell

Khi bạn chạy một ứng dụng RN, tất cả code Javascript của bạn sẽ được đóng gói lại với nhau thành một gói có tên là JS Bundle, Mã Native code được giữ nguyên

Việc thực thi của ứng dụng React Native sảy ra trong 3 luồng

  1. Javascript Thread: sử dụng JS Engine, để chạy JS Bundle
  2. Native/UI Thread: nó sử dụng để Native Modules và xử lý hoạt động giống UI Rendering, sủ dụng gesture events
  3. Ngoài ra Thread thứ 3 gọi là shadow thread, Được sử dụng để tính toán bố cục của các phần tử trước khi hiển thị chúng trên màn hình

Giao tiếp giữa JS và Native Threads được giao tiếp thông qua một cây cầu, Khi gửi dữ liệu đi qua cây cầu nó sẽ được chia thành từng phần(tối ưu hóa) và được phân ra dưới dạng JSON, Cây cầu này có thể chỉ xử lý các giao tiếp bất đồng bộ

Docusaurus Plushie

Một số điều kiện quan trọng:

JavascriptCore: nó là tên của Javascript Engine, cái mà React Native sử dụng để thực thi JS Code

Yoga: Là tên của Layout Engine, cái mà sử dụng để tính toán vị trí của phần tử UI của người dùng trên màn hình

1. Javascript Interface (JSI)

Trong công nghệ hiện tại, React native sử dụng Bridge Module để tạo các giao tiếp giữa JS code và Native threads, Mỗi khi data được gửi đến cây cầu, nó phải được đăng ký dưới dàng JSON, Khi dữ liệu được nhận ở phía bên kia nó cũng được giải mã

Nó có nghĩa là Javascript và Native hoạt động không biết về nhau (ie. JS Thread không thể gọi trực tiếp một phương thức trên luồng Native)

Một điều quan trọng khác, Các thông báo gửi qua cầu về bản chất là không đồng bộ, đây là một điều tốt cho hầu hết các trường hợp sử dụng, nhưng có một số trường hợp khi mã JS và mã gốc cần được đồng bộ hóa

Github page và deploy blog cá nhân

· 3 min read
Thinh Nguyen
React Native Developer

Bạn đang tìm kiếm các dướng dẫn đơn giản về cách đưa một ứng dụng React trên Heroku? Bạn muốn xuất bản một dự án vào phút cuối và không biết làm cách nào? Đây chính là hướng dẫn dành cho bạn

Trong hướng dẫn này, chúng tôi có một ứng dụng ReactJS đơn giản, chúng ta sẽ triển khai nó, Bạn cần sử dụng một ứng dụng nào đó có sẵn hoặc tạo mới nó sử dụng create-react-app, Đừng lo lắng, chúng ta sẽ thảo luận các bước từ đầu

Đã xây dựng ứng dụng thành công, Bây giờ là thời gian để xuất bản nó Có một số dịch vụ bạn có thể xuất bản ứng dụng của mình Heroku là một trong số chúng, Đó là một sự lựa chọn hiển nhiên

Khi nói điến việc triển khai, nó cung cấp cơ sở(facility) để xuất bản, quản lý, và scale ứng dụng, Bạn có thể thấy nó ghê gớm(intimidating) nhưng làm việc với Heroku rất dễ dàng

Đăng nhập tài khoản Heroku

Đến trang web Heroku và đăng nhập bằng tài khoản của bạn Sau khi đăng nhập thành công bạn sẽ được chuyển đến trang quản lý

Docusaurus Plushie

Tạo một tài khoản mới

Nhấn nút "Create a new App" để bắt đầu triển khai ứng dụng

Docusaurus Plushie

Nó sẽ hiển thị như bên dưới, điền đầy đủ thông tin bắt buộc và nhấn nút "Create App"

Docusaurus Plushie

Thêm Buildpacks

Để triển khai ứng dụng React trên Heroku, Chúng ta cần thêm buildpacks, nhấn đến tab Cài đặt và sau đó nhấn nút "Add BuildPack" bên trong Buildpacks section

Docusaurus Plushie

React buildpack URL của chúng ta là https://github.com/mars/create-react-app-buildpack, Copy dường dẫn và thêm nó vào buildpack giống bên dưới

Docusaurus Plushie

Sau khi nhấn nút lưu thay đổi. Buildpacks section sẽ lưu trữ đường dẫn URL mà chúng ta đã thêm, Tham khảo hình ảnh chụp bên dưới

Docusaurus Plushie

Triển khai ứng dụng Heroku: Sử dụng Heroku CLI

Nhấn tab Deploy cho Deploying React App sử dụng Heroku Git

Docusaurus Plushie

Chúng ta có ba phương thức triển khai ứng dụng lên Heroku

  1. Heroku Git
  2. Github
  3. Container Registry

Ở đây chúng ta chọn lựa chọn đầu tiên để triển khai: Heroku Git, Nhấn để tiếp tục

Docusaurus Plushie

Sau khi nhấn lựa chọn Heroku Git option trang bên dưới sẽ hiện ta hiện ta(appear)

Docusaurus Plushie

Bây, chúng ta cần cài đặt Heroku CLI trên máy, Xem trang Heroku CLI

Bạn có thể kiểm tra phiên bản sử dụng dùng command heroku –version

Tiếp theo chạy lệnh heroku login và một trang web hiện ra bạn login bằng tài khoản đã tạo ở trên

Sau khi đăng nhập heroku bạn có thể làm theo hướng dẫn để kết nối dụ án của bạn với heroku dashboard

một lưu ý quan trọng của heroku : You can now change your main deploy branch from "master" to "main" for both manual and automatic deploys, please follow the instructions here. hướng dẫn tại đây

Docusaurus Plushie

TADA : Quá đơn giản phải không nào

Tìm hiểu về React Native New Architecture

· 3 min read
Thinh Nguyen
React Native Developer

Nhóm React Native vừa thông báo về công nghệ mới của react native sẽ ra mắt trong năm 2022, Bạn có thể kiểm tra tại đây here

2022 sẽ là năm của kiến trúc mới trong mã nguồn mở

Vì bản phát hành gần đây, đây là khoảng thời gian tốt để tìm hiểu những thay đổi đang diễn ra và chúng có thể ảnh hưởng như thế nào để ứng dụng React Native của bạn

Trong bài viết này bao gồm hầu hết các thay đổi quan trọng bởi công nghệ mới

  • JavaScrip Interface(JSI)

  • Fabric

  • Turbo Modules

  • CodeGen

    Đầu tiên chúng ta sẽ đi tìm hiểu

Công nghệ hiện tại

Trước khi đến với công nghệ mới chúng ta sẽ tóm tắt công nghệ hiện tại làm việc như thế nào

Vui lòng lưu ý, Tôi chỉ bao gồm những điểm liên quan để hiểu blog này, nếu bạn muốn tìm hiểu nhiều hơn về công nghệ hiện tại vui lòng đọc tài liệu của react native

  • In a nutshell

Khi bạn chạy một ứng dụng RN, tất cả code Javascript của bạn sẽ được đóng gói lại với nhau thành một gói có tên là JS Bundle, Mã Native code được giữ nguyên

Việc thực thi của ứng dụng React Native sảy ra trong 3 luồng

  1. Javascript Thread: sử dụng JS Engine, để chạy JS Bundle
  2. Native/UI Thread: nó sử dụng để Native Modules và xử lý hoạt động giống UI Rendering, sủ dụng gesture events
  3. Ngoài ra Thread thứ 3 gọi là shadow thread, Được sử dụng để tính toán bố cục của các phần tử trước khi hiển thị chúng trên màn hình

Giao tiếp giữa JS và Native Threads được giao tiếp thông qua một cây cầu, Khi gửi dữ liệu đi qua cây cầu nó sẽ được chia thành từng phần(tối ưu hóa) và được phân ra dưới dạng JSON, Cây cầu này có thể chỉ xử lý các giao tiếp bất đồng bộ

Docusaurus Plushie

Một số điều kiện quan trọng:

JavascriptCore: nó là tên của Javascript Engine, cái mà React Native sử dụng để thực thi JS Code

Yoga: Là tên của Layout Engine, cái mà sử dụng để tính toán vị trí của phần tử UI của người dùng trên màn hình

1. Javascript Interface (JSI)

Trong công nghệ hiện tại, React native sử dụng Bridge Module để tạo các giao tiếp giữa JS code và Native threads, Mỗi khi data được gửi đến cây cầu, nó phải được đăng ký dưới dàng JSON, Khi dữ liệu được nhận ở phía bên kia nó cũng được giải mã

Nó có nghĩa là Javascript và Native hoạt động không biết về nhau (ie. JS Thread không thể gọi trực tiếp một phương thức trên luồng Native)

Một điều quan trọng khác, Các thông báo gửi qua cầu về bản chất là không đồng bộ, đây là một điều tốt cho hầu hết các trường hợp sử dụng, nhưng có một số trường hợp khi mã JS và mã gốc cần được đồng bộ hóa